MAY 01, 2025
Analysis of the 600-700ms interval.
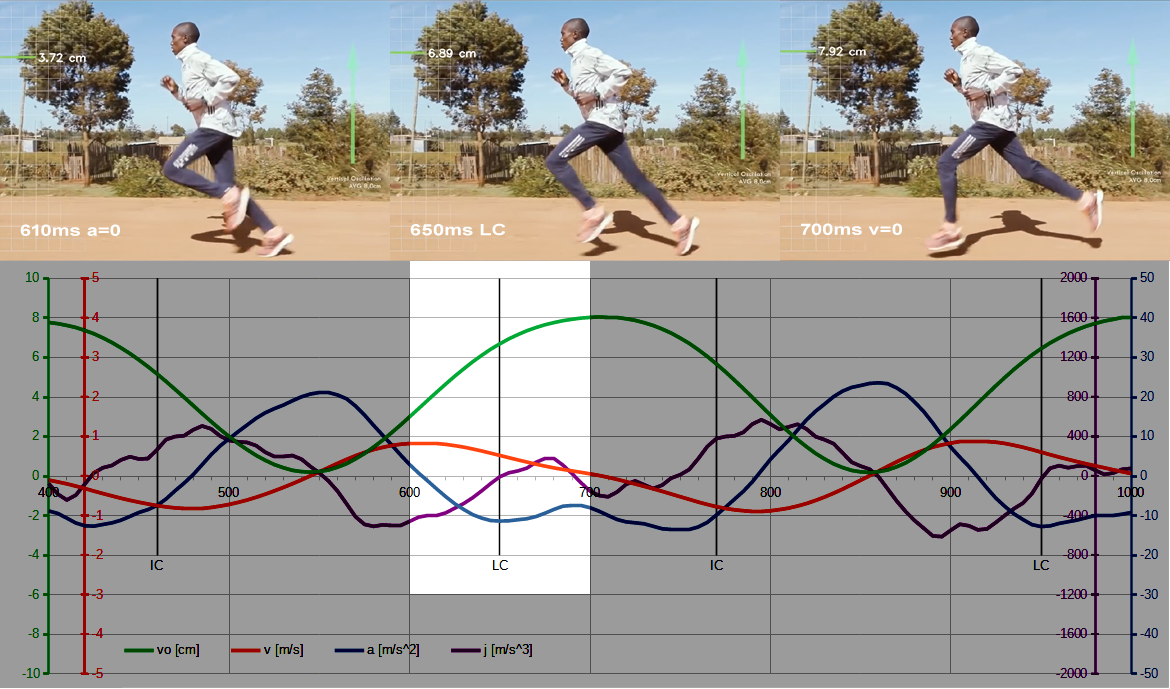
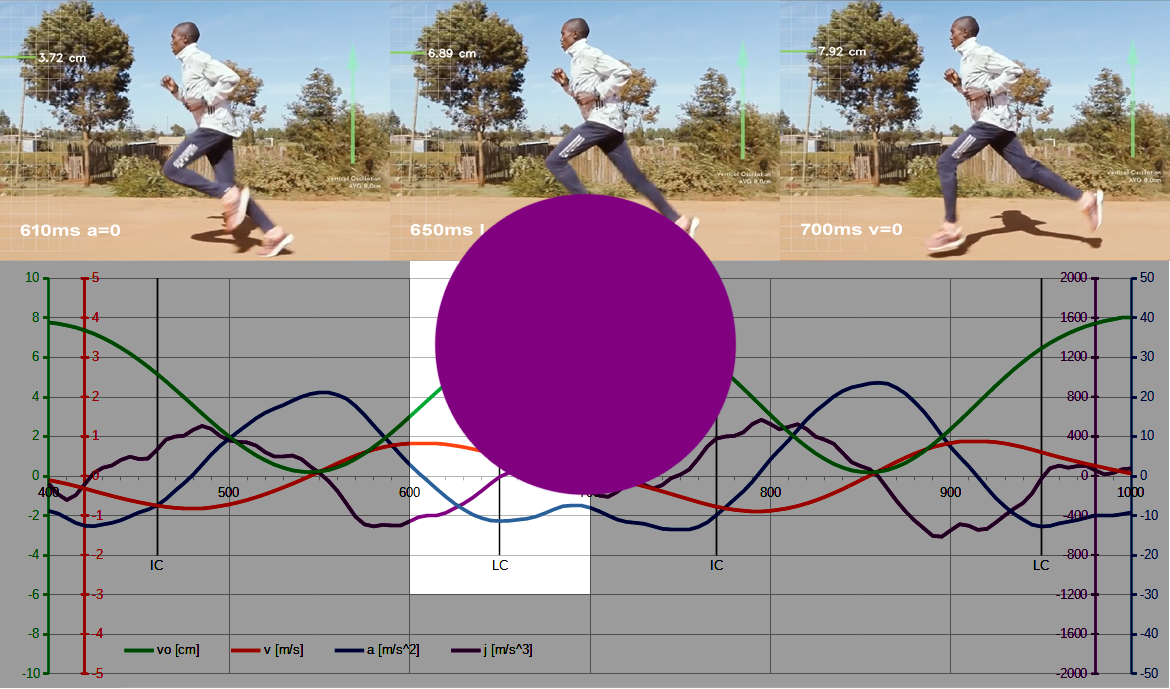
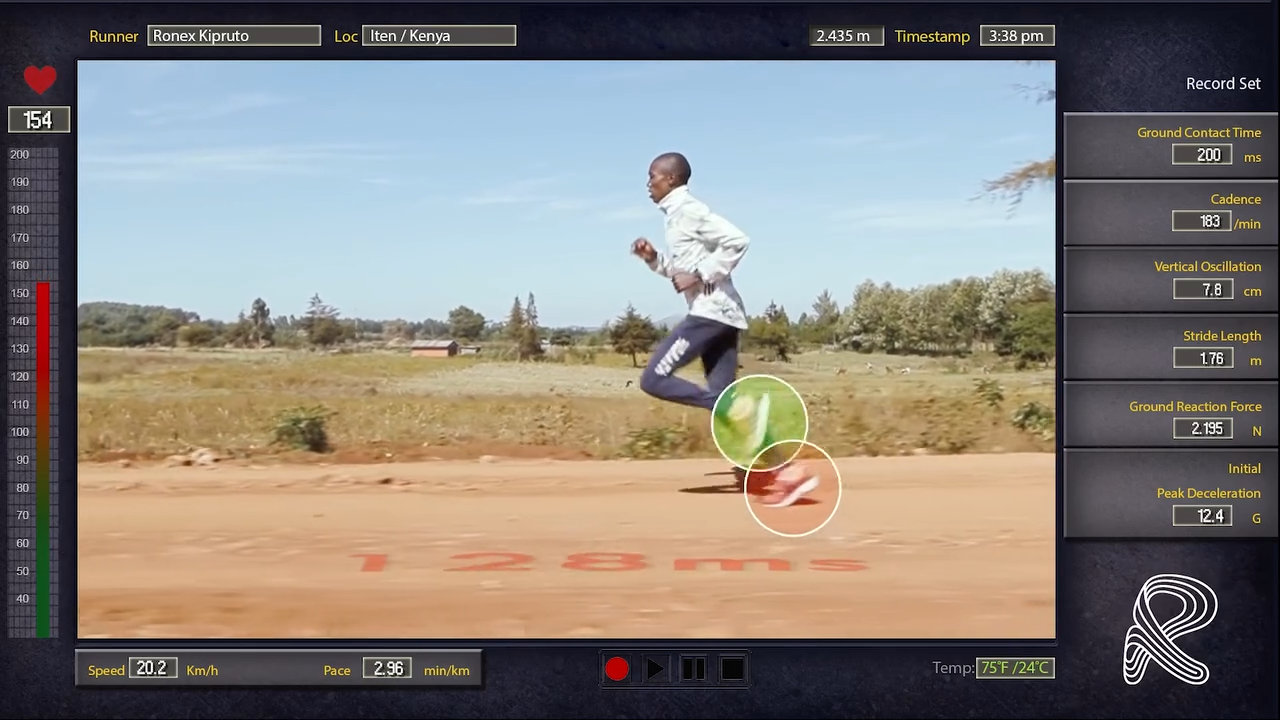
After 600ms, essentially nothing happens that could significantly affect the center of mass (COM) movement. The COM moves upward under momentum – everything crucial to the VO trajectory has happened earlier. The velocity begins to decrease, and the acceleration changes sign to negative at 610ms (the moment captured in the freeze frame below), meaning it begins to counteract the upward movement. The closer to the end of the GCT, the less dramatic it is. At 650ms, the foot leaves the ground (last contact – LC). By this time, the COM has already risen 7cm. During this time, the COM rises by 7cm. During the flight phase from 650ms to 700ms, the COM rises by only 1cm, reaching a total VO = 8cm.
How does Garmin know when LC occurs? Around LC, at 650 ms, the jerk value is minimal. Perhaps, similar to IC detection (I wrote about this in part 2), LC can also be estimated based on analysis of the jerk value (for IC: jerk = max, for LC: jerk = 0). It’s possible that Garmin uses such markers to determine the beginning and end of GCT.
After the foot leaves the ground (650 ms, LC), the ground reaction force (GRF) disappears, and only gravity acts on the COM trajectory. Vertical acceleration remains negative. Velocity decreases between 650 and 700 ms. After 700 ms, the COM reaches maximum altitude. Velocity drops to zero, and the COM direction changes to descent.
Impulse of force
The change in velocity over time results from the action of a force, according to Newton’s second law of motion (F = m · a). In the analyzed direction, the ground reaction force GRF (FGRF) acts upward, and the gravitational force F g acts downward on the COM. Their sum is the net force (F), which accelerates or decelerates the COM in the vertical direction. In movement analysis, it is also important to calculate the duration of this force. The total force effect on the COM is the net force impulse (I), which is the sum of the GRF impulse (IGRF) and the gravitational impulse (Ig).
The graph below shows the vertical net force acting on the center of mass during ground contact, obtained by averaging data from six running strides. Force is directly proportional to the acceleration of the COM, so the force graph has the same shape as the acceleration graph, differing only in scale (the yellow force axis is scaled by the runner’s body mass – 55kg). The graphical representation of the net force impulse is a hatched area (yellow) bounded by the force curve during the GCT. The magnitude of this area is expressed in Newton-seconds [Ns] and represents the total increase in vertical momentum COM during ground contact.
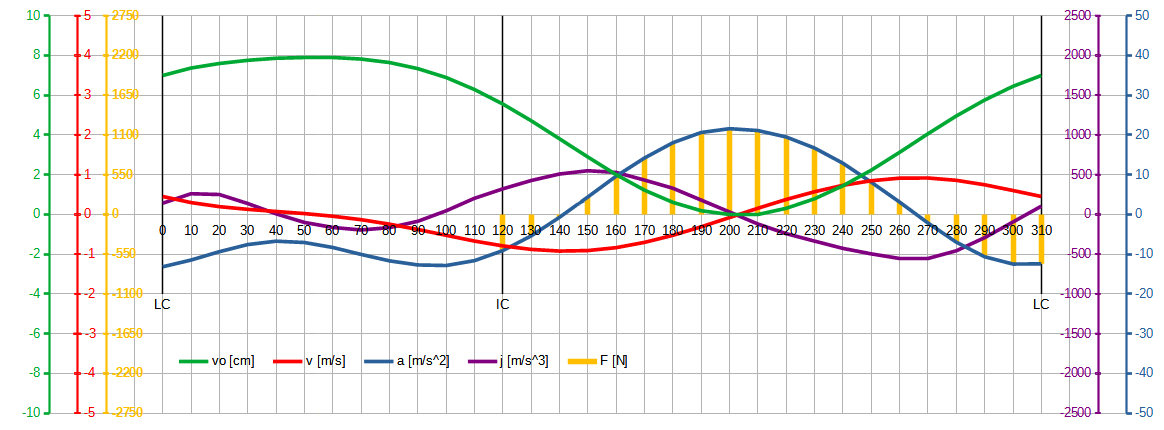
Knowing the GCT value of 190ms (0.19s) and the vertical velocity of the COM at the beginning and end of the GCT (vIC = −0.791m/s, vLC = 0.449m/s), we can calculate the total change in vertical velocity of the COM: Δv = vLC – vIC = 1.24m/s. Based on this change in velocity, we can calculate the net force impulse: I = m ⋅ Δv = 68.2Ns, and from this estimate the average net force: Favg = I / GCT ≈ 359N.
In practice, force platforms are used to measure ground reaction forces. These measurements are direct, not estimated from the trajectory of the center of mass, where additional damping and tissue deformation occur. Therefore, the results may vary. The above calculations only consider the vertical component of the net force and its effect on the center of mass movement. These calculations are based on a simplified spring-mass model which, although classic and used, has its limitations, for example it does not take into account joint rotation or the contribution of the fascia to stiffness modulation.