MAY 22, 2025
Vertical Oscillation (VO) is the height through which a runner’s center of mass rises during each stride. In addition to optical methods, oscillation can be measured with accelerometer sensors. Garmin uses built-in accelerometers in its devices, which record acceleration in three directions: up-down, forward-backward, and left-right. Acceleration is used to determine speed and position. From the position course (green line on the graph) the vertical oscillations can be estimated.
A single VO measurement from a single stride can be subject to error, so values are averaged over several strides and the result recorded every one or two seconds. Each such record appears as a dot on the graph. The color of the dot corresponds to the height range at which the center of mass was raised. The associated legend serves as quick feedback on the „quality” of the VO. This is a simple, intuitive way to assess running efficiency according to Garmin. However, like any simplification, it can also lead to interpretation issues.
Measuring VO on a graph.
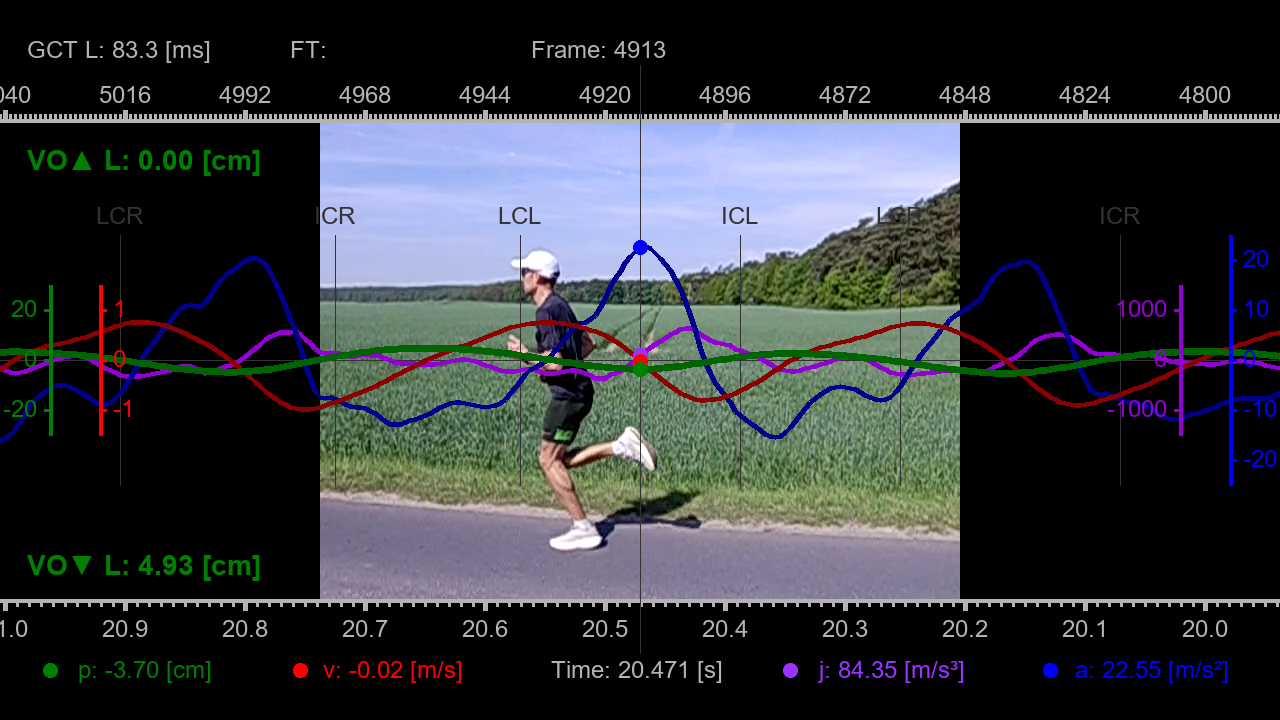
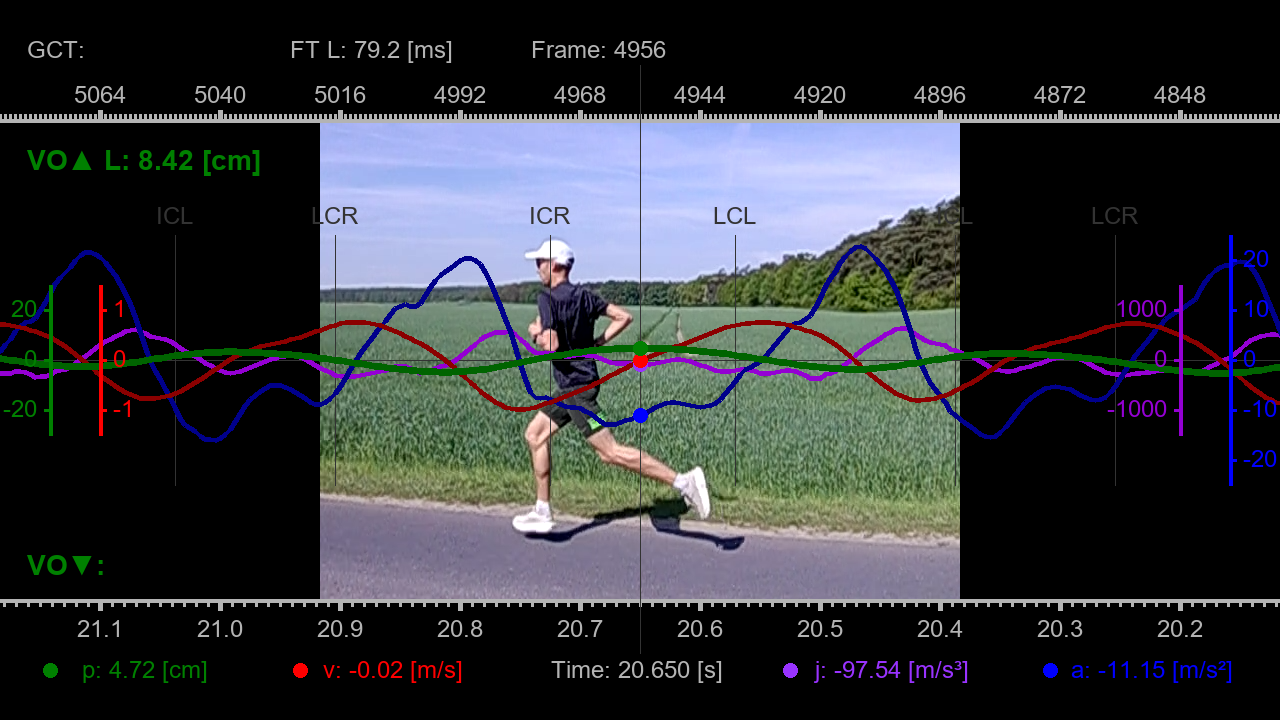
Vertical oscillations are calculated by integrating positive and negative vertical accelerations (blue line on the graph). The accelerometer oscillates around zero, which is the reference point for determining oscillation amplitudes. Freeze frame 4913 shows the sensor’s lower position, which is -3.70 cm (green counter p, in the lower left corner of the graph). Freeze frame 4956 shows the sensor’s upper position, which is 4.72 cm. The upward oscillation is the height difference between these positions. In this example, VO▲ = 8.42 cm.
In the working panel, you can animate the graph and track oscillations for 12 steps. A vertical marker in the center of the screen indicates the moment the position value is measured. This makes it easy to identify local VO maximum and minimum. The dashboard displays a distinction between the left and right legs. On the graph, the letter L appears next to the green VO label, indicating which leg the measurement applies to. This distinction is also visible for GCT (ground contact time) and FT (flight time).
The final, very interesting parameter is VO▼ with the downward arrow, or descending oscillation. This is the height difference between the pelvis position at the moment of first contact with the ground (IC) (freeze frame 4974 in the dashboard) and the lowest position (freeze frame 4995, VO▼ = 6.15 cm). This parameter can be used to estimate the vertical value of leg spring siffness – LSS, which I wrote about in part 3.
These measurements allow for more precise analysis of running dynamics. For example, you can determine whether one leg has a lower VO, a shorter flight time, or a longer ground contact time. Additionally, analyzing the velocity profile (red line on the graph) allows for a comparison of vertical takeoff and landing dynamics. Separating the left and right sides allows for a better understanding of movement asymmetry, potential sources of injury, and optimizing running technique. Such data is currently unavailable in Garmin’s graphs.