JUNE 26, 2025
The launch of the latest Garmin watch (model 970 with the Step Speed Loss – SSL function) is a good moment to return to the topic of horizontal oscillations (HO), which I have been writing about for years. At the time, I was wondering about horizontal pelvic accelerations, which are particularly visible in professional runners. For example, in this footage taken during a training session in Kenya in 2016, horizontal pelvic oscillations are clearly visible.
Traditionally, work on running technique is based on observation. Using accelerometer sensors, it is possible to analyze the course of horizontal position and velocity. Based on this data, new training concepts can be developed. Horizontal oscillations can be one of the most important biomechanical indicators. The aim of the following measurement experiment is to demonstrate running dynamics from a different perspective than traditional ones.
Horizontal oscillations are rapid changes in the horizontal velocity of the center of mass (COM) caused by the deceleration and after acceleration of the pelvis during the stance phase. Although this phenomenon is crucial for understanding running dynamics, it remains poorly described. This is because horizontal oscillations are more difficult to see than the better-known vertical oscillations. HO overlaps with running speed, has a smaller amplitude, and is often masked by limb, trunk, or clothing movements. This makes it rarely analyzed in practice, even though it may contain important information about running quality and efficiency.
The animation below shows a professional run at a pace of 2:19 min/km (average speed 720.7 cm/s). This is a very good technical and dynamic run by Mo Katir, one of the best middle and long-distance runners in the world. The movement of the center of mass (COM) is visible in two axes: vertical and horizontal. As in the first part of the article, video tracking was used here to detect points on the pelvis. The position of two green markers, at the front and back of the pelvis, was analyzed. Based on this, the midpoint was determined as the approximate location of the COM. This point is marked with a green cross.
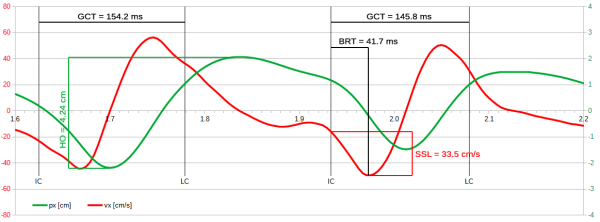
The vertical and horizontal lines in the animation indicate the average values of the pz and px COM coordinates. From pz and px, vertical velocity (VO) and horizontal velocity (HO) can be calculated. The method for calculating oscillations is described in detail in the previous part of this article. The graph below was created based on the animation. It shows a fragment of the COM trajectory (green line) and horizontal velocity (red line) in two following steps.
Horizontal Oscillations
The graph shows two stance phases (GCT) separated by the flight phase. The green line represents the horizontal component of pelvic displacement px. As the pelvis moves back relative to the rest of the body, the line descends, as it moves forward, it rises. At ground contact (IC), the pelvis deceleration phase begins, lasting approximately until halfway through the GCT, during which time the line descends. The COM then reverses direction: the line begins to rise, indicating the transition from deceleration to the propulsion phase, as the pelvis moves forward.
Horizontal Velocity
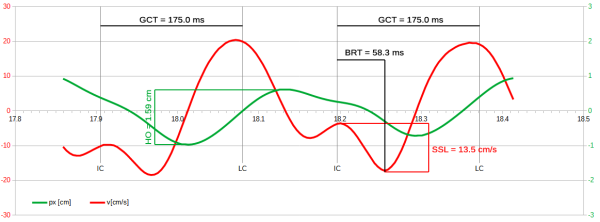
The red line represents the horizontal pelvis velocity vx. During the deceleration phase, velocity decreases and reaches a minimum before the lowest point of displacement. Garmin’s new metric (SSL) measures how much horizontal velocity decreases during the stance phase (details on this feature can be found on the official website). Velocity then increases, peaking before the peak of displacement.
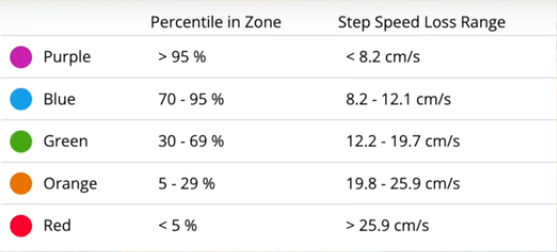
The graph below shows a version of the one from Garmin’s website, with the COM trajectory added. This represents a run at a pace of 3:23 min/km (average speed of 492.5 cm/s). The measured SSL is 13.5 cm/s, which represents a speed decrease of about 3%. Garmin interprets this result as average level of running dynamics. This is confirmed by the table below, which shows the SSL value ranges.
Classical Interpretation
Braking while running cannot be eliminated, but it can be minimized. Loss of speed means the leg acts as a brake, slowing the body with each step. To accelerate again, the runner must generate greater force, which increases the energy cost of running. Technically sound running is associated with smooth running, with minimal fluctuations in horizontal velocity. From this perspective, the lower the SSL, the better. The SSL table leaves no doubt: the goal is to minimize velocity losses during the stance phase. This approach represents classic running biomechanics.
So what about Katir’s run? In his case, the SSL is a huge 33.5 cm/s (a speed drop of about 5%). This undermines the validity of this metric, as a world-class athlete records a result classified as „suboptimal.” Perhaps it’s worth looking at running dynamics from a different perspective.
Is braking a bad thing?
In the third part of this article, I mentioned non-metabolic work, which is characterized by a short duration and increased generation of propulsion by passive structures. At the beginning of the stance phase, the muscles of the supporting leg are in quasi-isometric tension. This tension doesn’t generate significant stretching of the fibers. The fibers are more twisted and tightened, stabilizing and stiffening the joints. This mechanism likely allows for the achievement of extreme stiffness values (LSS), which I also discussed in Part 3 of this article.
If we look at braking not as something that works against us, slows us down and increases the energy cost of running, but as an integral part of the propulsion, then the braking phase becomes a time when the fascia is charged with elastic potential energy. This time is several dozen milliseconds, and the shorter it is, the faster and more efficient the charging process. The tissue discharge then occurs just as quickly. In effect, a non-metabolic push-off means the body is pulled forward rather than pushed as in a classic metabolic push-off. From this perspective, running dynamics are no longer associated with smooth movement and small speed fluctuations. On the contrary, dynamic and economical movement has a „jerky” character.
Braking Time
The graphs indicate the Braking Time (BRT) section – the time from IC to the minimum speed. Katir’s BRT is 41.7 ms (28.6% GCT), while in the Garmin example run, it’s 58.3 ms (33.3% GCT). Measuring braking time and its maximum value provides information about the quality of this process. For example, at the same running pace, a competitive runner could achieve a higher or similar SSL result compared to an amateur runner, but a shorter BRT. This would indicate a greater amount of non-metabolic work, and therefore greater running dynamics. Such analyses are not currently being performed on a larger scale, so it is difficult to predict whether the BRT parameter will also cause problems in interpretation. Further research is necessary.


