APRIL 5, 2025
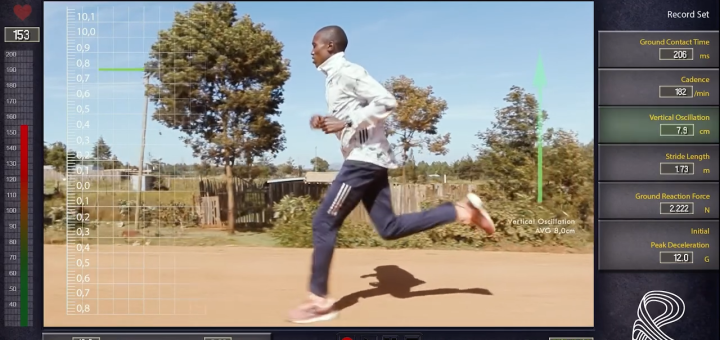
With the vertical oscillation (VO) values (green line) collected using an algorithm tracking the green marker in the video, velocity and acceleration can be determined. The graph below shows the velocity (red line) and acceleration (blue line). Velocity tells us how quickly position changes as a function of time. Acceleration tells us how quickly velocity changes. Using simple data processing methods, we were able to obtain relatively clean lines.
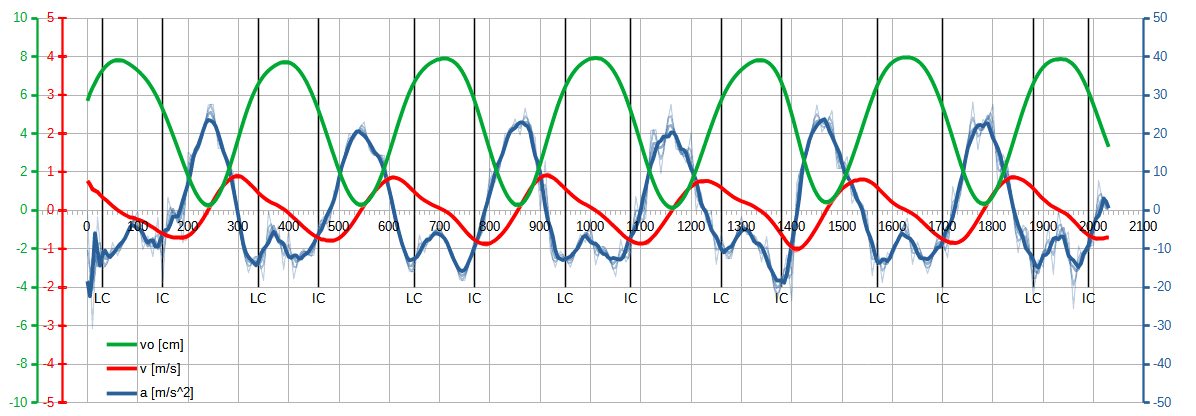
Knowing the athlete’s average horizontal speed and the vertical speed values for the red peaks and valleys, it is possible to estimate the takeoff and landing angles, respectively. Analyzing the original video clip (5:03-5:11), we can determine the average running pace at 3:04 min/km (5.43 m/s). The average value of vertical maximum speed is 0.84 m/s. The average value of vertical minimum speed is -0.85 m/s. From this information, we can determine the takeoff and landing angles. The takeoff angle is ~8.8°, the landing angle is ~8.9°.
Biomechanical interpretation: a smaller take-off angle indicates a more horizontal run, with less vertical kinetic energy. For elite runners, take-off and landing angles are in the range of 7-10°. This is also associated with low VO values of 6-8 cm. To sum up: video analysis using image detection and simple data processing confirms the parameters of competitive running observed in reality and described in the literature.
The graph also shows the landing moments -initial contact (IC) and lift-off moments – last contact (LC). The relationships between IC and LC can be analyzed with the intersections of the blue acceleration line with the time axis. More on this and other relationships in the next post.