APRIL 13, 2025
Higher-end sports watches with running dynamics tracking allow you to track parameters like ground contact time, vertical oscillation, stride length, and cadence. After your workout, you can analyze these data on graphs composed of colored dots. But what’s really hidden behind those dots? It turns out, quite a lot.
Garmin doesn’t share its algorithms, so we can only estimate and speculate how it processes user-supplied data. The following analysis is a process that could be described as reverse engineering. It involves understanding how it works step by step. It’s a bit like uncovering the secrets hidden in a finished product without access to technical documentation and original descriptions.
A very interesting video showing a competitive athlete running was used for the analysis. From the video, we were able to obtain the course of vertical oscillations of the center of mass (COM) thanks to video tracking, which automatically tracks the movement of a specific object in a sequence of images. I wrote about this process in the post: Visualization of Vertical Oscillation Values Using AI. The graph below shows the course of vertical oscillations (green line) and the determination of three derivatives based on it. I already wrote about two derivatives – velocity and acceleration – in the post: Velocity and Acceleration curves of Vertical Oscillations. This time, I’m adding the jerk, the third, rather mysterious derivative of vertical oscillations.
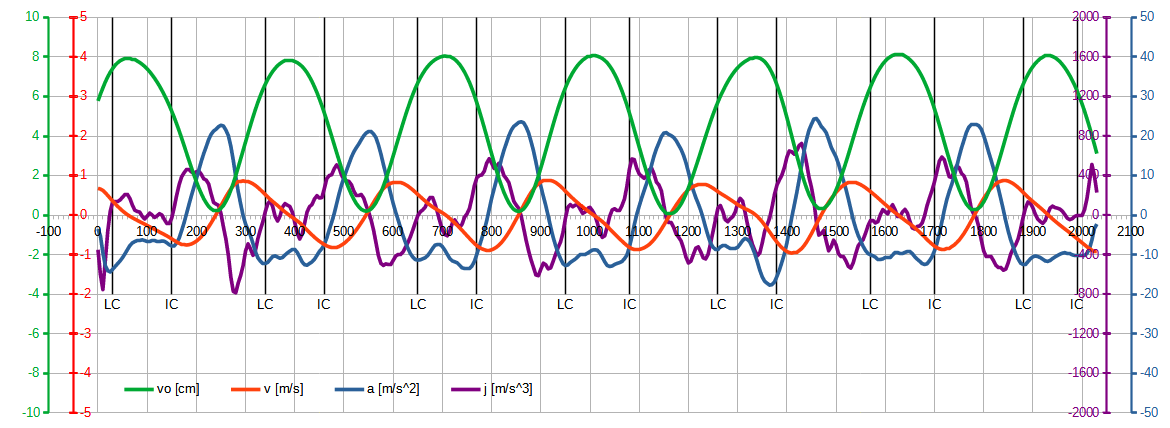
The graph shows a 2-second run, during which the athlete takes approximately 6 steps. This entire graph could therefore be reduced to the titular Garmin dot. This demonstrates the potential still available in analyzing running dynamics data.
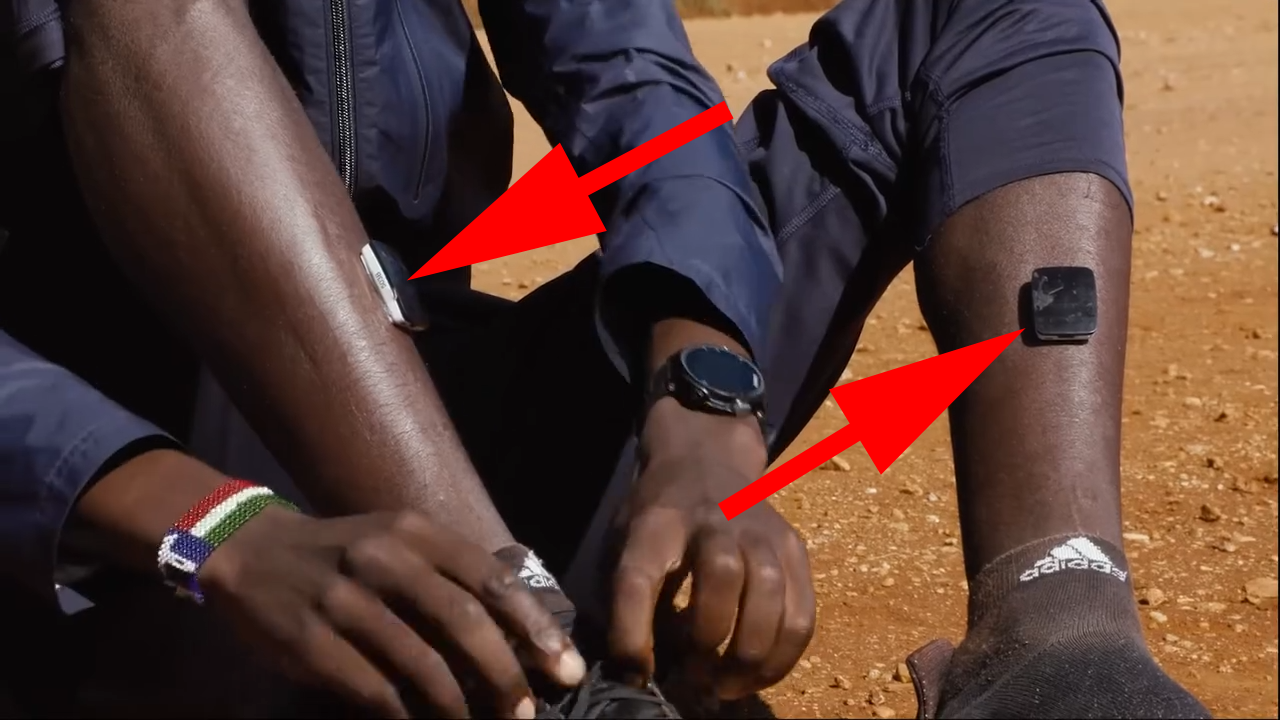
Preliminary description: The green line, resembling a sine wave, represents the raw data collected from the tracking. The vertical green axis, scaled in centimeters, defines the vertical oscillation range from 0 to approximately 8 cm. The other axes correspond to derivatives with their assigned colors. The horizontal time axis is scaled in milliseconds with 10 ms intervals, corresponding to one freeze frame from the original recording. The time axis plots the moments of initial contact with the ground (Initial Contact), which marks the beginning of the Ground Contact Time (GCT), and last contact with the ground (Last Contact), which marks the end of the GCT. We have information on the average oscillation values (8 cm) and can estimate the average running pace (3:04/km). We know that IMU (Inertial Measurement Unit) sensors, which measure acceleration and angles during running, were placed on both shins. Similar sensors, operating on the same principles, are found in Garmin’s watch and accessories—the HR belt and POD. The IMU sensors our team is currently developing also have the ability to perform these measurements.
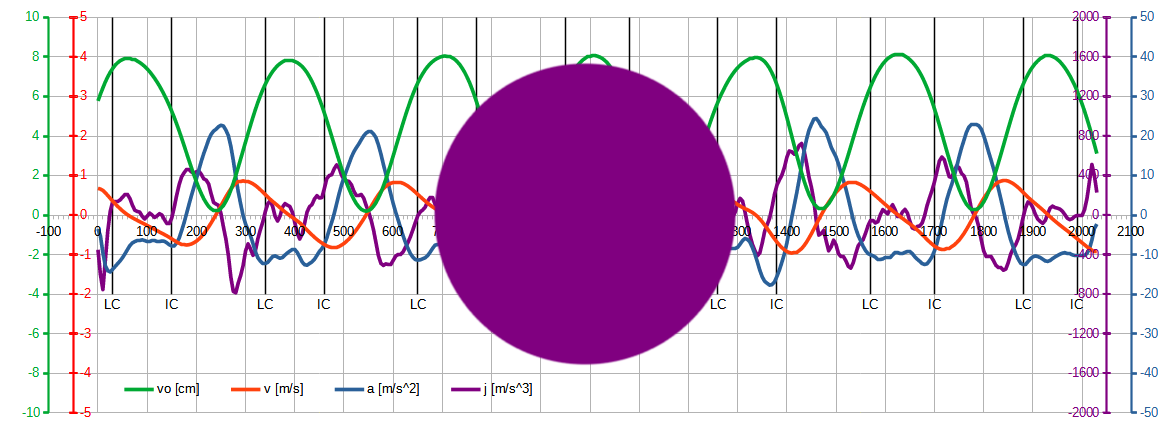
The input is based on a time window between 400-1000ms (graph below). Here, two stance phases are shown, separated by a flight phase. The first stance phase, between IC at 460ms and LC at 650ms, concerns the right leg and lasts 190ms. The second stance phase for the left leg, between IC at 770ms and LC at 950ms, lasts 180ms. The interval information is complemented by the flight phase duration of 120ms. This allows us to determine individual GCT for each leg. Based on this, Garmin calculates ground contact time balance, but balance measurement is only possible from an HR belt or POD. The watch itself cannot distinguish between left and right legs, providing only GCT without balance. How does the belt or POD determine body side? The IMU measures vertical, horizontal, and lateral accelerations. The information about the support leg is likely sourced from the latter. Additionally, the IMU measures angles, so it can also detect body roll and rotation. Reliable measurement requires the sensor to be centrally positioned on the body or symmetrically positioned on the left and right sides of the body.
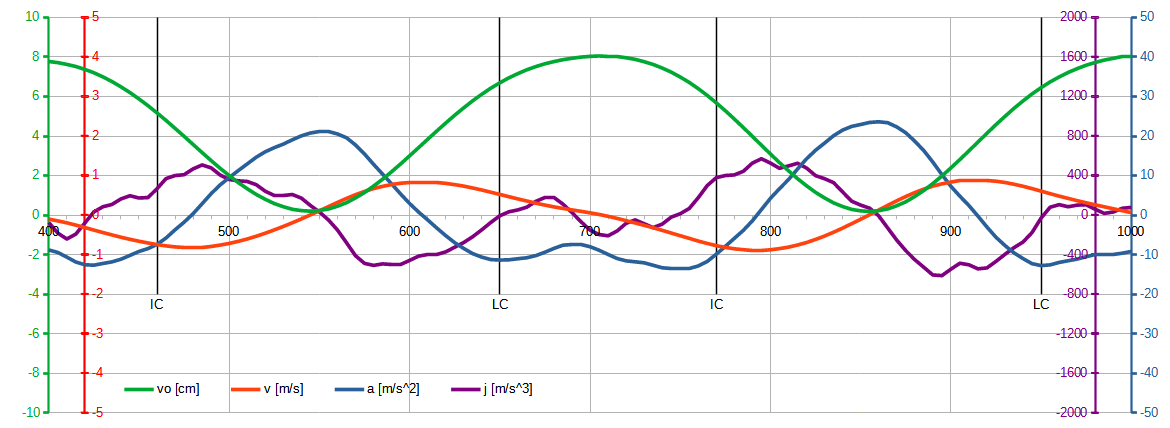
The above graph fragment allows for easier tracing of vertical oscillations during the flight and stance phases and determining their contributions. For example, in the 400-550ms interval, the downward movement of the COM is approximately 3 cm in the flight phase and 5 cm in the stance phase. In contrast, the upward movement of the COM from 550-700ms accounts for nearly 7 cm in the stance phase and only 1 cm in the flight phase. It is therefore clear that most of the vertical oscillations of the center of mass occur during the stance phase. It should be emphasized that there is a certain measurement error resulting from the fact that the oscillations are not measured directly from the pelvis but from the tibia.
The VO COM measurement is therefore estimated in the local system based on the signal from the vertical accelerometer, with the support of the horizontal accelerometer and gyroscopes. This utilizes the fact that the signal from the shin oscillates with the stride cycle, exhibiting characteristic patterns of descent, contact, rebound, and flight. Therefore, it must be filtered and multiplied by an experimentally determined calibration factor that takes into account amplitude and phase shift. All of this contributes to the final algorithm, which is the manufacturer’s own proprietary concept and is not publicly available.
How accurate can the estimates be? The error from a watch can exceed 10%. HR and shin measurement will be more accurate, and more accurate enough. This is especially true if (as with Garmin) the analysis is limited to indirectly identifying peaks and valleys — the maximum and minimum VO values — rather than analyzing the details of the slope gradients. The most reliable VO measurements will, of course, be from the pelvis. Here, the Garmin POD is the best solution, but nothing more. The measurement frequency of 0.5-1Hz, provided by the manufacturer, is like a large purple dot obscuring the entire running dynamics. It’s possible, but it would be good to have more, or rather, more often. Ideally, the user (coach) would have a lab mode option, allowing data collection at the original 200-400Hz frequency.