APRIL 16, 2025
The purpose of analyzing the graph below is to discuss the temporal relationships between the position derivatives, not to determine their absolute values, as is the case with the jerk, which is highly dependent on the sampling rate, data filtering, and the order of signal processing (which is typical for higher derivatives). The original footage has a frame rate of 100 frames/s, which allows for the determination of velocity values. However, acceleration values, and especially the jerk, are associated with greater uncertainty. Vertical oscillations (VO) of the pelvis are not measured directly but indirectly from sensors placed on the tibias. All of this influences the determined values, but typical values of vertical pelvic velocity observed during running are within a range of approximately +/- 1 m/s. Acceleration in the stance phase reaches 25 m/s², and in the flight phase should oscillate around -10 m/s², reflecting only the effect of gravity on the center of mass. Approximate values of the derivatives position are sufficient to focus solely on timing and the relationships between their courses.
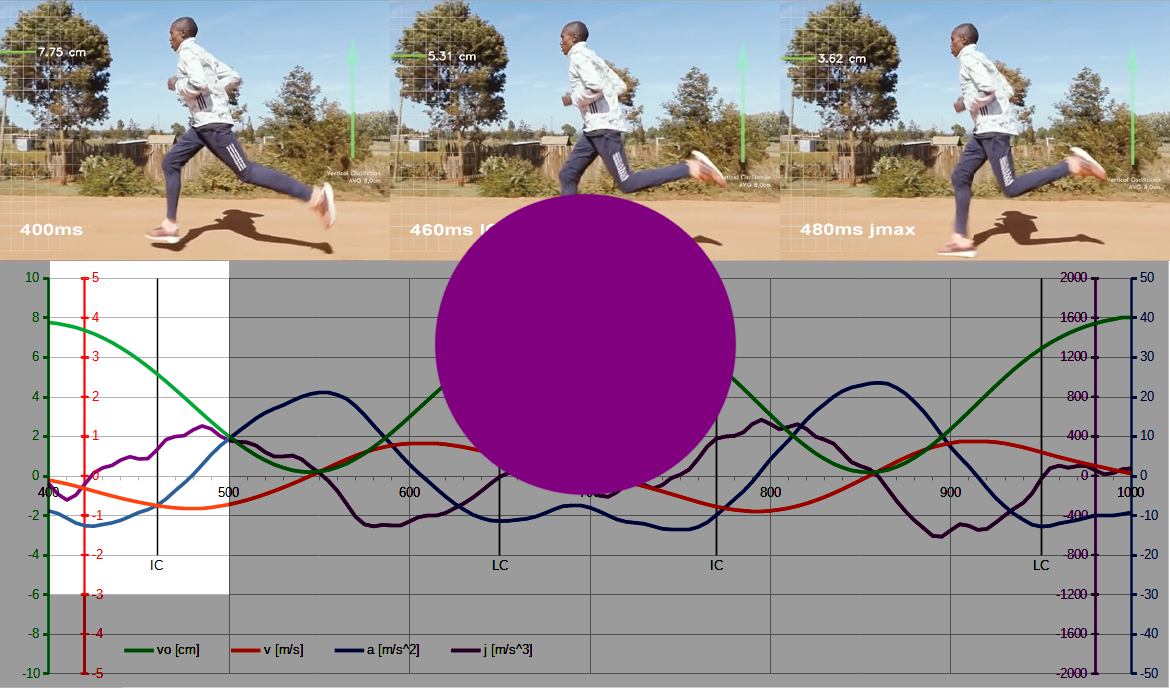
Analysis of the 400-500ms interval.
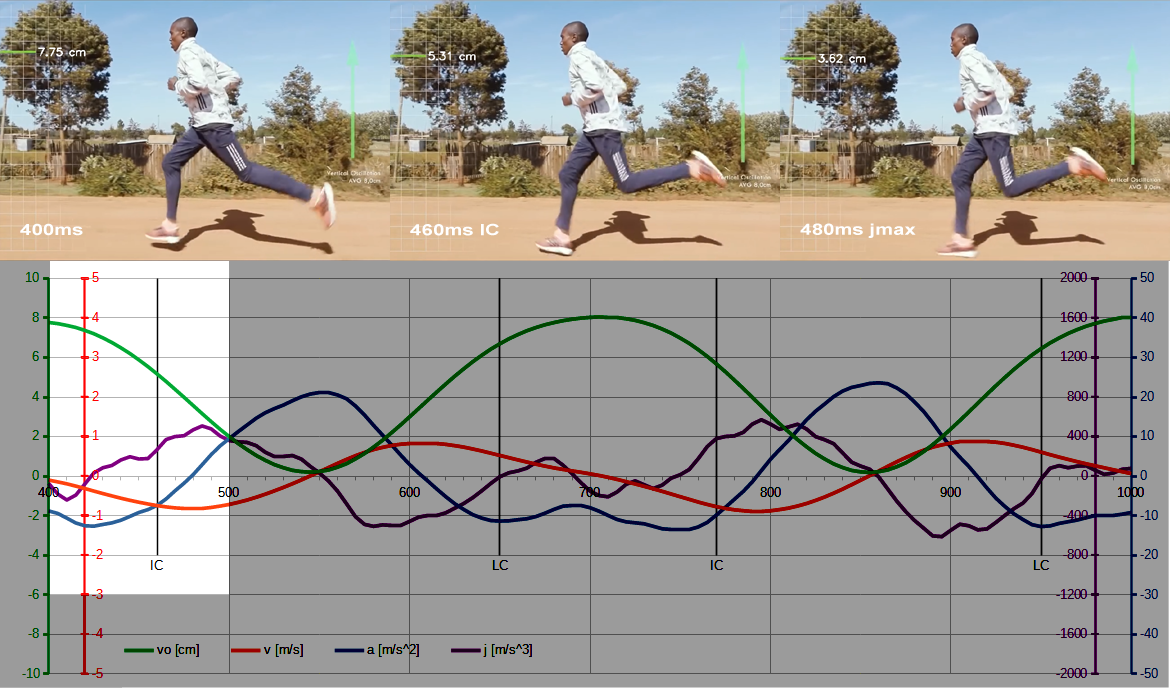
At 400 ms, the body’s center of mass (COM) is slightly below its maximum height of 8 cm (green line) and has a vertical velocity (red line) close to 0 m/s, indicating the moment just after the change from ascent to descent. Under the influence of gravity, during the flight phase from 400 to 460 ms, the COM descends by about 3 cm and its vertical velocity becomes increasingly negative (by convention, downward vertical velocity is negative), indicating downward acceleration. Acceleration during this time (blue line) should theoretically be negative and approximately constant, corresponding to the force of gravity of ~ -10m/s^2. Acceleration during this time (blue line) should theoretically be negative and approximately constant, corresponding to the force of gravity of ~ -10m/s^2. Since acceleration does not change, its derivative – jerk (purple line), defined as the rate of change of acceleration over time, should oscillate around zero. Why is the acceleration not theoretically constant in the 400-460ms range and the jerk is not zero?
This is only in theory. In practice, the center of mass acceleration trajectory is estimated based on measurements from sensors on the shins. During the stance phase, the shins and COM trajectories are quite similar. However, in the flight phase, the lower leg has a significantly different trajectory. The algorithm accounts for these differences, but they are likely not fully compensated by the coefficients modeling the COM motion. The different tissue behavior of the tibia and pelvis must also be taken into account. A sensor placed on the pelvis will have a smoother COM signal due to the greater mass and inertia of the tissues. Measurement noise also contributes to this. All of this contributes to larger acceleration fluctuations and leads to non-zero jerk values during flight.
At 460 ms, initial contact (IC) occurs. However, the COM continues to move downward. During 460–480 ms, the absolute value of the vertical velocity increases, indicating that the COM is descending faster. Conclusion: IC is not the onset of pelvic deceleration. Velocity and acceleration are negative, meaning that COM decreases more rapidly, but with decreasing dynamics because the absolute value of acceleration decreases. The decrease in acceleration dynamics is associated with the appearance and increase of the ground reaction force (GRF). A graphical representation of the rate of GRF increase is the jerk value progression from approximately zero in IC to jmax in 480 ms. In the 460–480 ms range, the GRF values are smaller than the force of gravity and therefore have no influence on the COM trajectory, which decreases by almost 1.5 cm in 480 ms.
Around 480 ms, the COM reaches its maximum descent velocity. At this time, the jerk reaches its maximum. GRF and gravity balance each other. From this point, the ground reaction force begins to dominate gravity, meaning the COM begins to decelerate. GRF and acceleration increase, but with decreasing dynamics, as reflected by the decreasing jerk from 480 to 500 ms. COM falls by another 1.5 cm in the analyzed interval, reaching VO = 2 cm in 500 ms.
Biomechanical layer: Just before the IC, at 460 ms, the front leg muscles activate (so-called pre-activation). The 460-480 ms interval marks the beginning of kinetic energy absorption in soft tissues and the accumulation of potential elastic energy there, but this will not affect the downward movement of the pelvis. Only after 480 ms (the moment captured in the freeze frame below) does the increasing ground reaction force begin to slow the pelvis’ descent, stopping it at 550 ms and rebounding upwards from 550 to 700 ms. It is important to remember that this analysis is performed without considering the horizontal component of the ground reaction force. While in the stance phase, modeling of the vertical pelvic movement, based on measurements from the sensors on the tibias, shows similarity of trajectories, in the case of the horizontal pelvic movement, assuming such similarity may be incorrect.
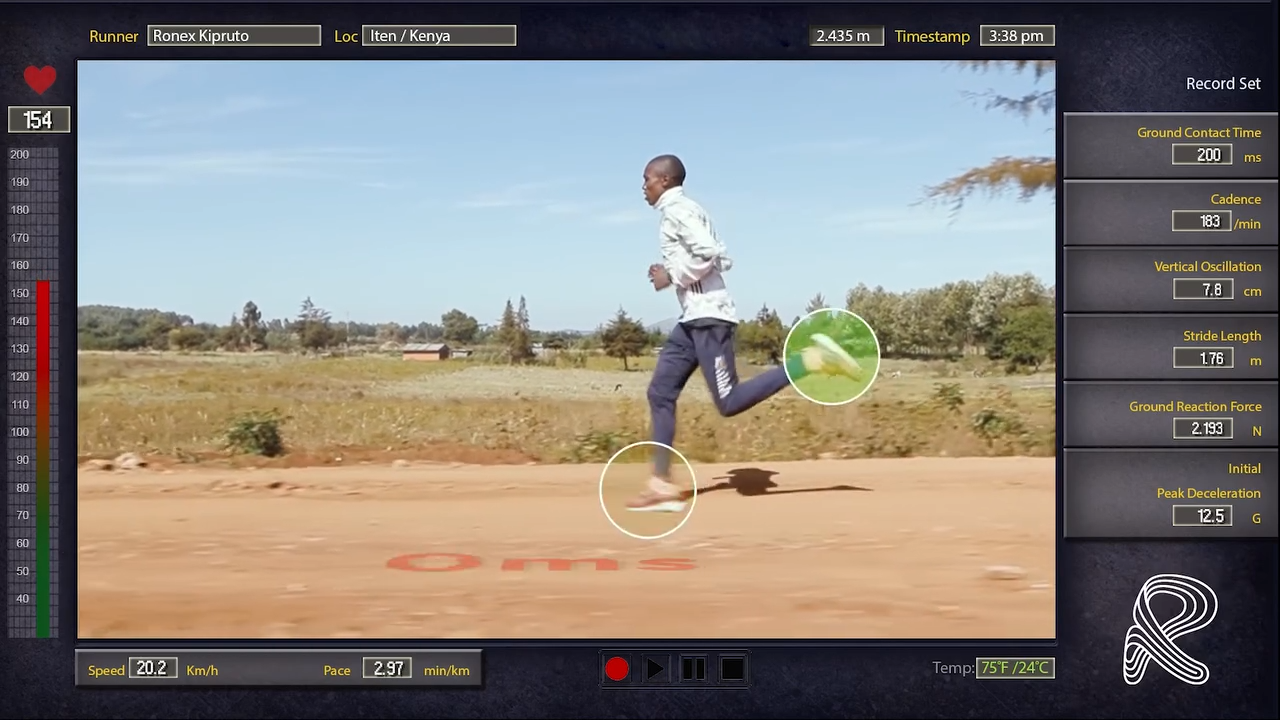
Technological layer: How does Garmin know when IC or max VO is? Event detection algorithms not only look for simple acceleration peaks in the raw accelerometer data (in this case, the accelerometer measuring vertical acceleration), but can analyze the entire acceleration signal shape and its changes characteristic of an impact. For example, they can look for a sudden increase in the signal’s steepness (a large jerk value) as an early indicator of IC, even before the peak reaches its maximum amplitude. The freeze frame above is interpreted as IC in the original recording. This is quite late by visual standards. One could go back a freeze frame or two and determine the visual IC there.
Garmin can use built-in running biomechanics models that estimate vertical pelvic movements based on general movement and parameters such as height, weight, and stride length. Accelerometer data is then used to calibrate and select these models for a specific runner and their current run. Finally, there’s machine learning. Algorithms can be trained on extensive datasets provided by users. The models can learn to recognize patterns in the accelerometer signals, which determine IC, VO, and other parameters. The manufacturer does not provide raw data from the accelerometers or conversion algorithms, so we can only speculate about the technology.