APRIL 26, 2025
Analysis of the 500-600ms interval.
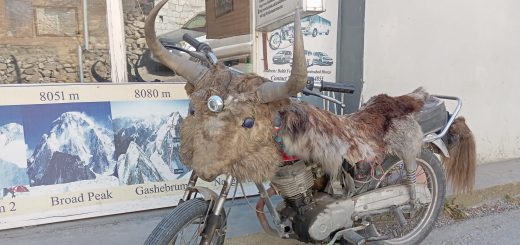
Up to 550 ms, the center of mass continues to move downward, but its dynamics change. The vertical oscillation (green line VO) from the 2 cm level at 500 ms approaches its minimum value. The COM trajectory becomes flatter, and the descent is increasingly slower. The COM velocity (red line) decreases. Vertical acceleration (blue line) increases and is a direct consequence of the ground reaction force (GRF) dominating gravity. The system is in the phase of energy absorption and deceleration of the COM’s downward motion. Around 550 ms, the acceleration reaches its maximum, reflecting the maximum GRF value. Velocity at this point is zero, meaning that deceleration, which lasted approximately 60-70 ms (from the maximum jerk value at around 480 ms to zero at 550 ms), ends. The ground begins to force the COM to change its vertical motion direction from descent to ascent.
550ms of running corresponds to the local peak of the GRF (the highest point of the blue „hill”). Assuming the runner weighs 55kg and the maximum vertical acceleration during this phase is 20-25m/s², the peak ground reaction force reaches a value of 1600-1900N (calculated using the formula: FGRF = m ⋅ (a + g)). Considering that the force of gravity acting on the runner is approximately 540 N, this means that in this short moment he experiences a force of 3-3.5 times greater than his own weight.
Knowing the height of the center of mass at the beginning of braking (480 ms, VO ≈ 3.5 cm) and the maximum ground reaction force achieved at the end of the braking phase, when the COM is at its lowest position, one can estimate the stiffness of the stance leg (Leg Spring Stiffness – LSS). Support leg stiffness reflects the leg’s ability to store and release energy during ground contact, which influences movement economy. LSS is defined as the ratio of the maximum GRF to the maximum vertical displacement of the COM during ground contact and is expressed by the formula: LSS = FGRF / VO ≈ 46000–54000 N/m. This range of LSS values applies only to elite runners. Sample studies (1, 2, 3) of amateur runners report values in the range of 7000–16000 N/m. Devices like Stryd estimate LSS based on acceleration and ground contact time measurements, using own biomechanical models. The exact calculation methods used by Stryd and the LSS ranges for elite, sub-elite, and amateur runners are not officially published. It’s important to remember that different LSS estimation methods can yield different results, and their accuracy also depends on the quality of the input data and the modeling assumptions. For example, if the assumption is changed and instead of 480ms, takes 460ms as the beginning of the support leg flexion, where VO ≈ 5cm (visual IC, which I wrote about in the second part), it gives much lower values of LSS ≈ 32000–38000N/m.
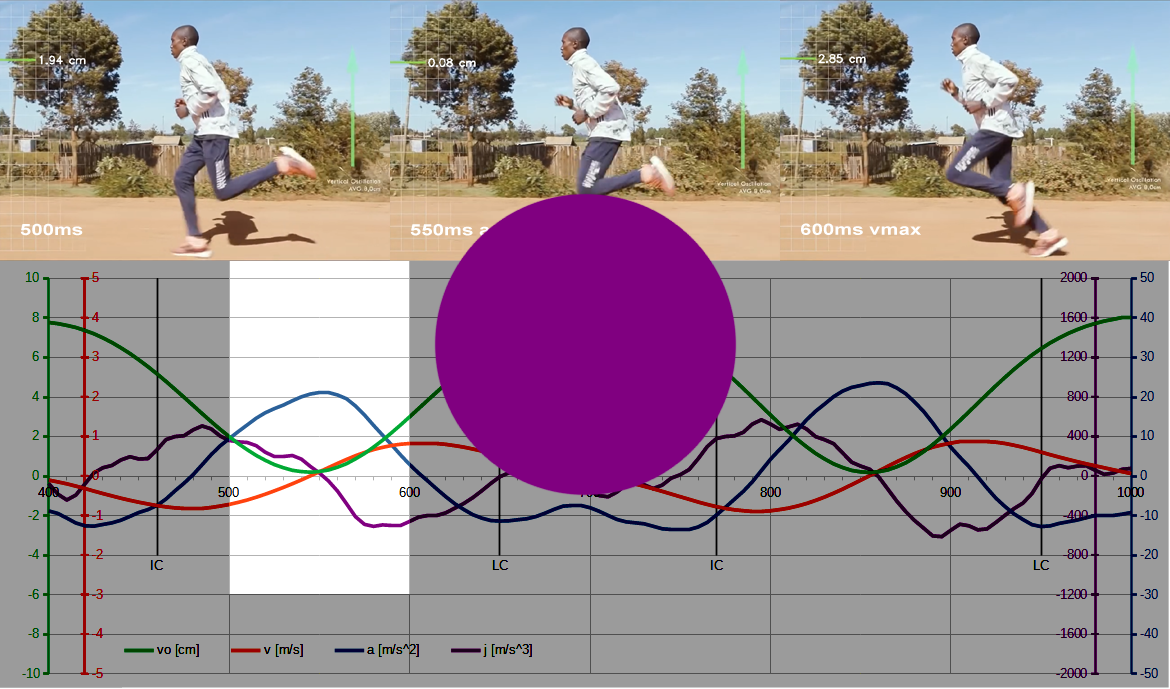
At 550 ms (the moment captured in the freeze frame below), the center of mass reverses direction and the takeoff phase begins. VO increases by about 3 cm. The COM’s velocity increases, reaching a maximum after 600 ms, but this increase becomes slower because acceleration decreases. The GRF decreases and gradually equalizes the force of gravity, meaning the takeoff weakens. The COM movement becomes inertial, losing speed under the influence of gravity.
From a biomechanical perspective, the 500–600 ms interval represents the deepest phase of flexion of the stance leg, joint stiffening, and the accumulation of potential elastic energy in the tissues. Tissue activity during this time is described by the classic eccentric-concentric muscle model. However, given current knowledge of the role of connective tissue, such a model is overly simplistic. It does not describe the quasi-isometric nature of muscle activity, collagen phase transitions, or the complex interactions of muscle, tendon, and fascia in the very short time of approximately 50 milliseconds.
It should be noted that the analysis is limited to the vertical component of pelvic movement. It is not possible to take conclusions about the horizontal component based on this. Pelvic horizontal oscillations (HO) overlap with running pace. They are more difficult to capture and measure using video detection methods, which are based on tracking the position of a reference point in an image sequence. Analyzing the COM waveform and its derivatives for the horizontal component could potentially provide more information about running technique and dynamics. The HO waveform could better inform about the quality of tissue function in terms of non-metabolic work, as well as a greater contribution of passive connective tissue structures to propulsion. However, this would require better video quality or direct measurements of horizontal accelerations using IMU (Inertial Measurement Unit) sensors placed on the pelvis.
A true understanding the full dynamics of running would require analysis of all three motion components, including pelvic lateral oscillations. Especially this lateral direction gives information about potential dysfunctions such as pelvic shift and drop, which suppress HO dynamics, reducing propulsion and locomotion efficiency.