AUGUST 16, 2025
The previous article introduced running dynamics measured in the horizontal direction. It described the braking process, the absorption and loading of elastic energy in tissues. This phase can be parameterized by measuring the step speed loss (SSL) and the time it takes to occur (Braking Time – BRT). This article presents a methodological problem related to the measurement itself and the development of parameterization of running dynamics in the take-off phase.
Methodological problem.
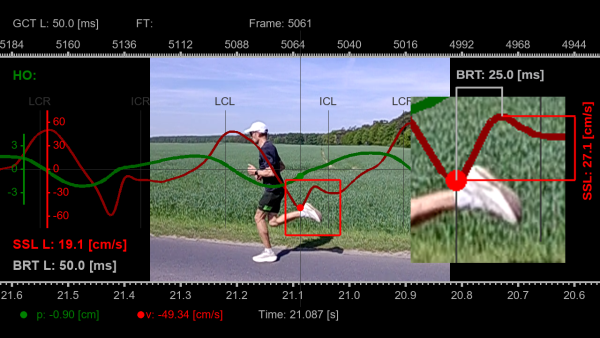
It is possible to precisely determine the value of a given parameter and the moment of its occurrence, but there are also doubts about interpretation, as in the example described below. The SSL value measured according to Garmin’s definition (discussed in the previous section) may be underestimated. This can be seen in the freeze frame from the working panel (frame 5061), where the SSL max value is 19.1 cm/s at BRT = 50 ms. However, from the moment of first contact with the ground (IC), the speed does not decrease but may increase slightly, reaching a local peak (visible in the enlarged image on the right). If we shift the starting point of the SSL measurement to this peak, we will obtain an SSL value higher by over 40%. In this case, the BRT will be shortened by 50%.
Horizontal Oscillations (HO)
During running, the pelvis makes a quick, short backward and then forward movement in the stance phase. These relative displacements are crucial for propulsion, which is primarily based on tissue elasticity. On the graph, the displacement line is green. The backward displacement from the average position can reach 2, even 3 cm. The same applies to forward displacement. The HO value is the sum of these displacements, which in the case of Katir’s run exceeded 4 cm (HO = 4.24 cm). Horizontal oscillations reflect both the system’s ability to decelerate the center of mass and store energy in the tissues, and to dynamically accelerate it during the take-off phase, releasing this energy.
Retracting the pelvis a few centimeters affects the tension of the fascial bands. In addition to its ability to elastically deform, the fascia also has the ability to change state, resembling a non-Newtonian fluid. The more rapid and brief the deceleration, the more dense the fascia becomes for a fraction of a second. This creates a kind of fascial corset that stiffens the body, absorbing some of the impact during landing, supporting the muscles, and then contributing to the rapid release of stored energy, generating a dynamic take-off. Fascia researcher Eli Thompson discusses this in the movie.
The condition for this effect to occur is a significant deceleration (high SSL value) and a short duration (short BRT) of the order of several dozen milliseconds. Such short action times lead to hypotheses on the border between biology and hydraulics, where the key role is played by the fluid pressure in the body and the speed of its increase, causing an effect called hydraulic amplification. James Earls also discusses hydraulic amplification in his book, Born to Walk. These effects will be particularly noticeable in professional sports. Perhaps, then, a more accurate explanation of the physics of running would be to replace biomechanics with biohydraulics.
Take-off phase.
The take-off phase, just like the braking phase, can be parameterized by measuring maximum horizontal velocity and the time it takes to achieve it. This complements the description of the propulsion, in which the fascia releases energy. The faster this process occurs, the better the running dynamics.
Elastic Recoil
This term has long been used in running and refers to the ability of elastic structures to return to their original length or volume after being deformed. Volume change, as a form of deformation, may be more appropriate here. Elastic Recoil (ER) can parameterize the energy release process in tissues. Combined with Elastic Recoil Time (ERT), we obtain information on the dynamics of the take-off. The combination of a high ER value and a short ERT can be a measure of the body’s responsiveness to dynamic braking.
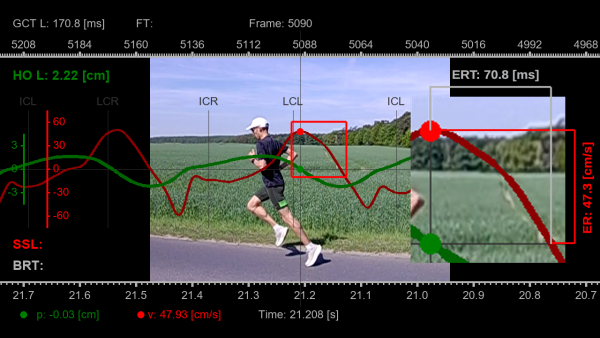
On the graph, ER is measured from the moment the pelvis reaches maximum retraction (trough on the green course of the position). This is the moment captured in freeze frame no. 5073. This corresponds to approximately zero velocity on the graph or the average running pace. The maximum value ER = 47.3 cm/s occurs at ERT = 70.8 ms (freeze frame no. 5090 – below).
Measuring horizontal velocity values and their changes over time can become an important indicator in assessing the effectiveness of strength training methods and working on running technique. It is also a new approach to running, in which biomechanical measurements are increasingly important in improving running performance.


