OCTOBER 14, 2025
Anterior Pelvic Tilt refers to the orientation of the pelvis in the sagittal plane (rotation around the transverse axis). During running, its range usually does not exceed a few degrees. It can be recorded either by visual motion analysis or by measuring the angular changes of a sensor placed on the pelvis. This aspect is rarely analyzed in detail in the scientific literature, which makes understanding the dynamics of this movement dependent on further research. New metrics describing pelvic tilt changes may provide key insights into the dynamic stabilization of the stance phase and the efficiency of force transfer.
The animation of Mo Katir’s running gait, discussed in part 6, has been supplemented with a new parameter — TILT (pitch) — and a graphical indicator in the form of a green, tilted line illustrating the time course of pelvic inclination.
Running the animation in real time reveals short oscillatory movements of the indicator corresponding to anterior tilt fluctuations, triggered by ground impact and braking dynamics. The indicator makes it possible to observe that the seemingly stable pelvis and torso undergo small, repetitive rotational oscillations.
In the analyzed run, the maximum deviations from the baseline mean value (TILT = 28.9°) were +3.2° toward anterior tilt and –4.9° toward posterior tilt. The peak angular velocity during the first part of the stance phase, along with the timing of its occurrence, form the basis of the proposed running metrics.
TR (Tilt Rate) represents the maximum positive angular velocity during the stance phase.
TRT (Tilt Rate Time) represents the time interval measured from the point of maximum posterior tilt (the beginning of anterior tilt development) to the moment when TR reaches its peak value.
The graph below shows the course of pelvic inclination (green line – pitch) and its rate of change, or angular velocity (red line – pitch rate). The terms pitch and pitch rate refer to signals oscillating around zero, since the mean pelvic tilt value was subtracted from the entire dataset.
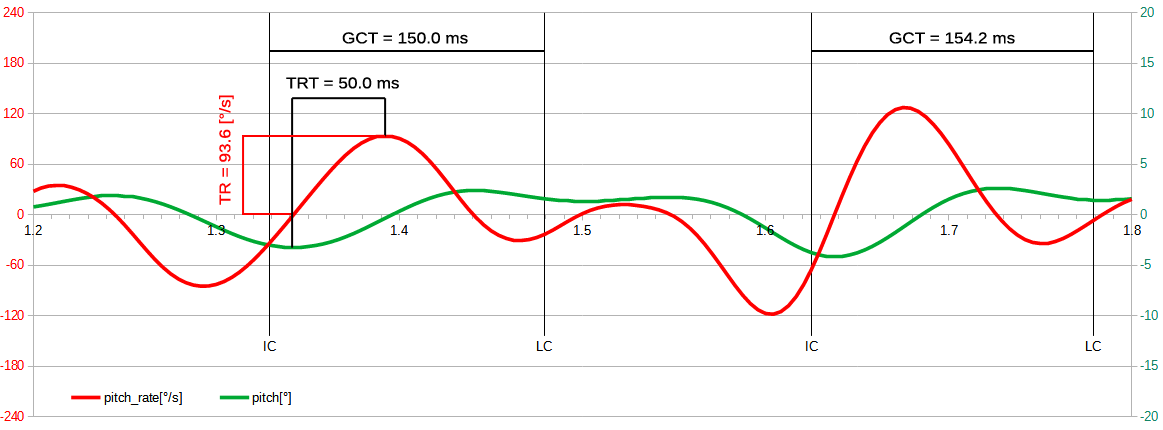
The beginning of TRT marks the reversal of pelvic rotation, from posterior to anterior tilt. From that point, anterior tilt begins to increase. The occurrence of the maximum TR value approximately coincides with the peak of braking dynamics in the horizontal axis. These phenomena are related, but their complete interpretation requires further research.
The second animation, presented in the working panel, displays the pitch and pitch rate signals overlaid on the running motion. This visualization allows observation of how the pelvis deviates and how dynamically its orientation changes throughout the stride. The maximum deviations from the baseline mean (TILT = 24.2°) were +4.8° toward anterior tilt and –5.8° toward posterior tilt.
Both animations and measurements presented here are observational in nature.
Biomechanical context
During ground contact, the pelvis rotates toward increased anterior tilt. This motion may raise tissue tension, temporarily stiffening the body and enhancing dynamic stability. Its magnitude and rate depend on running speed. Movement observations suggest that stiffness can be intentionally increased through pelvic positioning in greater anterior tilt combined with a counter movement of the lower ribs. This counteraction positions the torso relative to the pelvis, creating a tension chain through the trunk that increases perceived stiffness. In practice, this may result in a stronger and more dynamic push-off. However, this phenomenon requires further research and measurement to better understand its implications for running economy and stability.