NOVEMBER 05, 2025
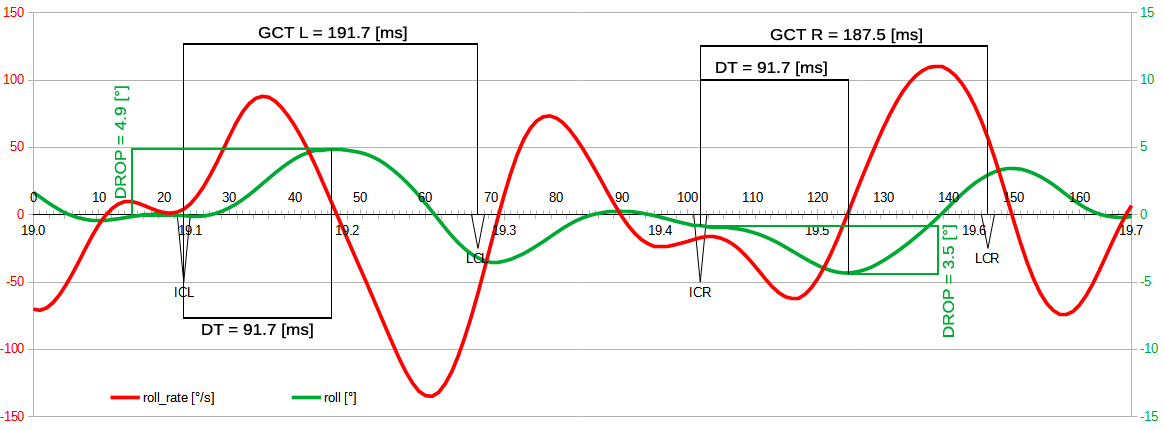
Pelvic drop is a phenomenon where, during the stance phase, the pelvis drop downward on the swing leg side. This means a partial loss of lateral stability in the frontal plane. The motion sensor records it as pelvic rotation. The graph shows markers of the Ground Contact Time (GCT): ICL–LCL for the left leg and ICR–LCR for the right leg. The analysis covers these time intervals. The green line represents the pelvic drop angle in degrees. When landing on the left leg, the pelvis rotates clockwise (line above the axis), and when landing on the right leg — counterclockwise (line below the axis). The difference between the angle at the moment of contact (IC) and the maximum drop is: DROP L = 4.9° and DROP R = 3.5°. The maximum values occur around 91.7 ms after the start of contact. These intervals are marked on the graph as DT (Drop Time).
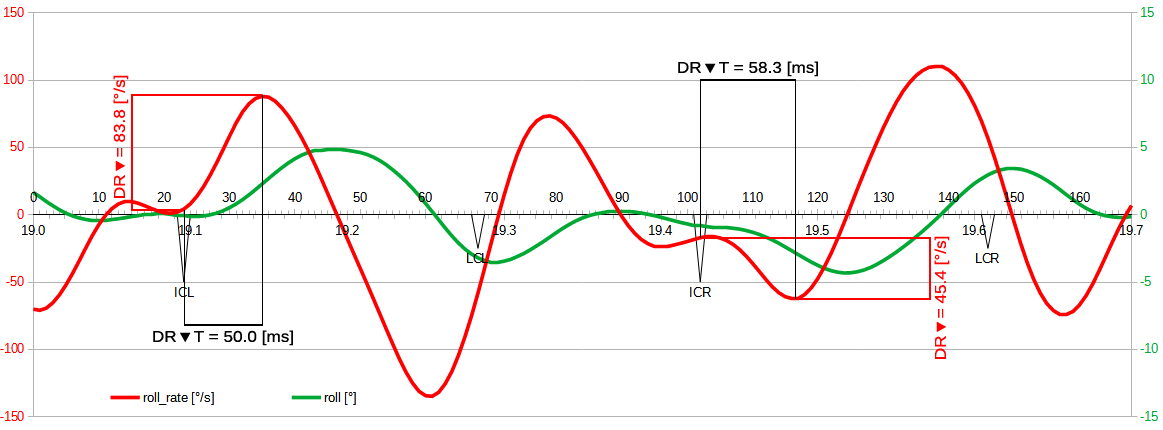
Drop entry dynamics (DR▼ – Drop Rate, down arrow).
Drop Rate represents the angular velocity of the pelvis, expressed in degrees per second. It shows how fast the pelvic drop angle changes during stance and when it reaches its maximum. The maximum entry dynamics of the drop is the difference between the DR value at contact (IC) and its peak DRmax. For the left leg: DR▼ L = 83.8°/s , and for the right leg: DR▼ R = 45.4°/s. The peak dynamics occur at 50.0 ms for the left leg and 58.3 ms for the right. These intervals are marked on the graph as DR▼T (Drop Rate Time, down arrow).
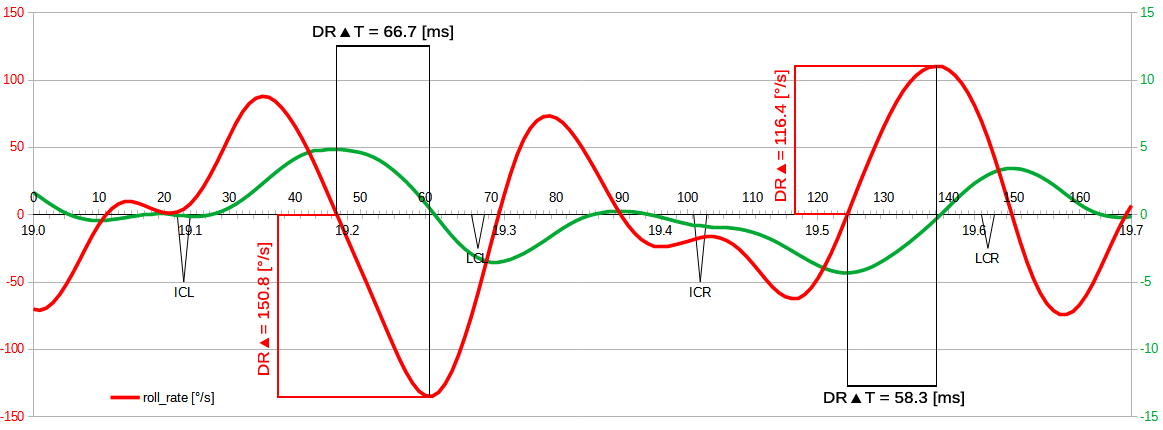
Drop exit dynamics (DR▲ – Drop Rate, up arrow).
The measurement of angular velocity at the drop exit is made in the same way as at the entry. The maximum value for the left leg is DR▲ L = 150.8°/s, and for the right leg: DR▲ R = 116.4°/s. The moment of occurrence is measured from the point where the pelvis changes the direction of rotation — that is, from the peak of the green curve. It appears at 66.7 ms for the left leg and 58.3 ms for the right. These intervals are marked on the graph as DR▲T (Drop Rate Time, up arrow).
The discussed time courses can be viewed in the working panel. The panel shows a green indicator visualizing continuous pelvic drop motion in both directions during running. Below the chart, there is a roll counter, scaled in degrees. It shows the current pelvic angle and the initial inclination in the flight phase, just before landing. These data make it possible to observe the movement dynamics in real time and have diagnostic potential.
Biomechanical layer.
Pelvic drop and its entry dynamics indicate a partial loss of elastic energy. It appears as deformation and a temporary destabilization of the stance phase during braking and tissue loading. These effects are unavoidable, but they can be reduced by decreasing the entry rate of the drop.
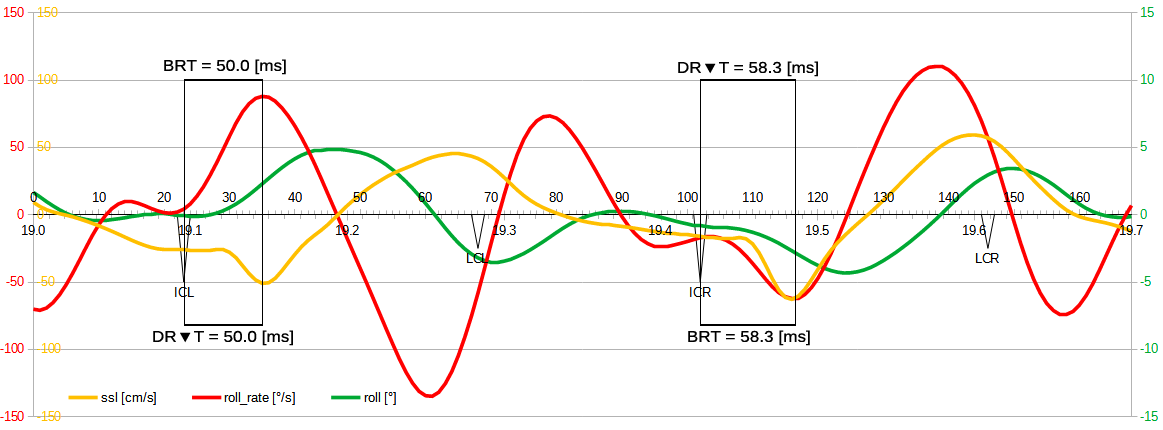
On the graph, the moment of maximum pelvic drop rate (DR▼T) coincides with the braking dynamics time (BRT – Braking Time) visible on the yellow line of horizontal pelvic velocity, described in Part 6.
This overlap (BRT = DR▼T) shows that lateral instability is related to braking in the sagittal plane.
Shortening the DR▼T time may therefore also reduce the exit dynamics (DR▲T).
Interestingly, the exit dynamics from the drop are higher than the entry dynamics — this means that the system compensates for the earlier loss of stability, which may weaken the push-off phase. Quantitative evaluation of pelvic drop and its dynamics requires comparison with data from other runs and athletes. This phenomenon still needs further research and measurement.